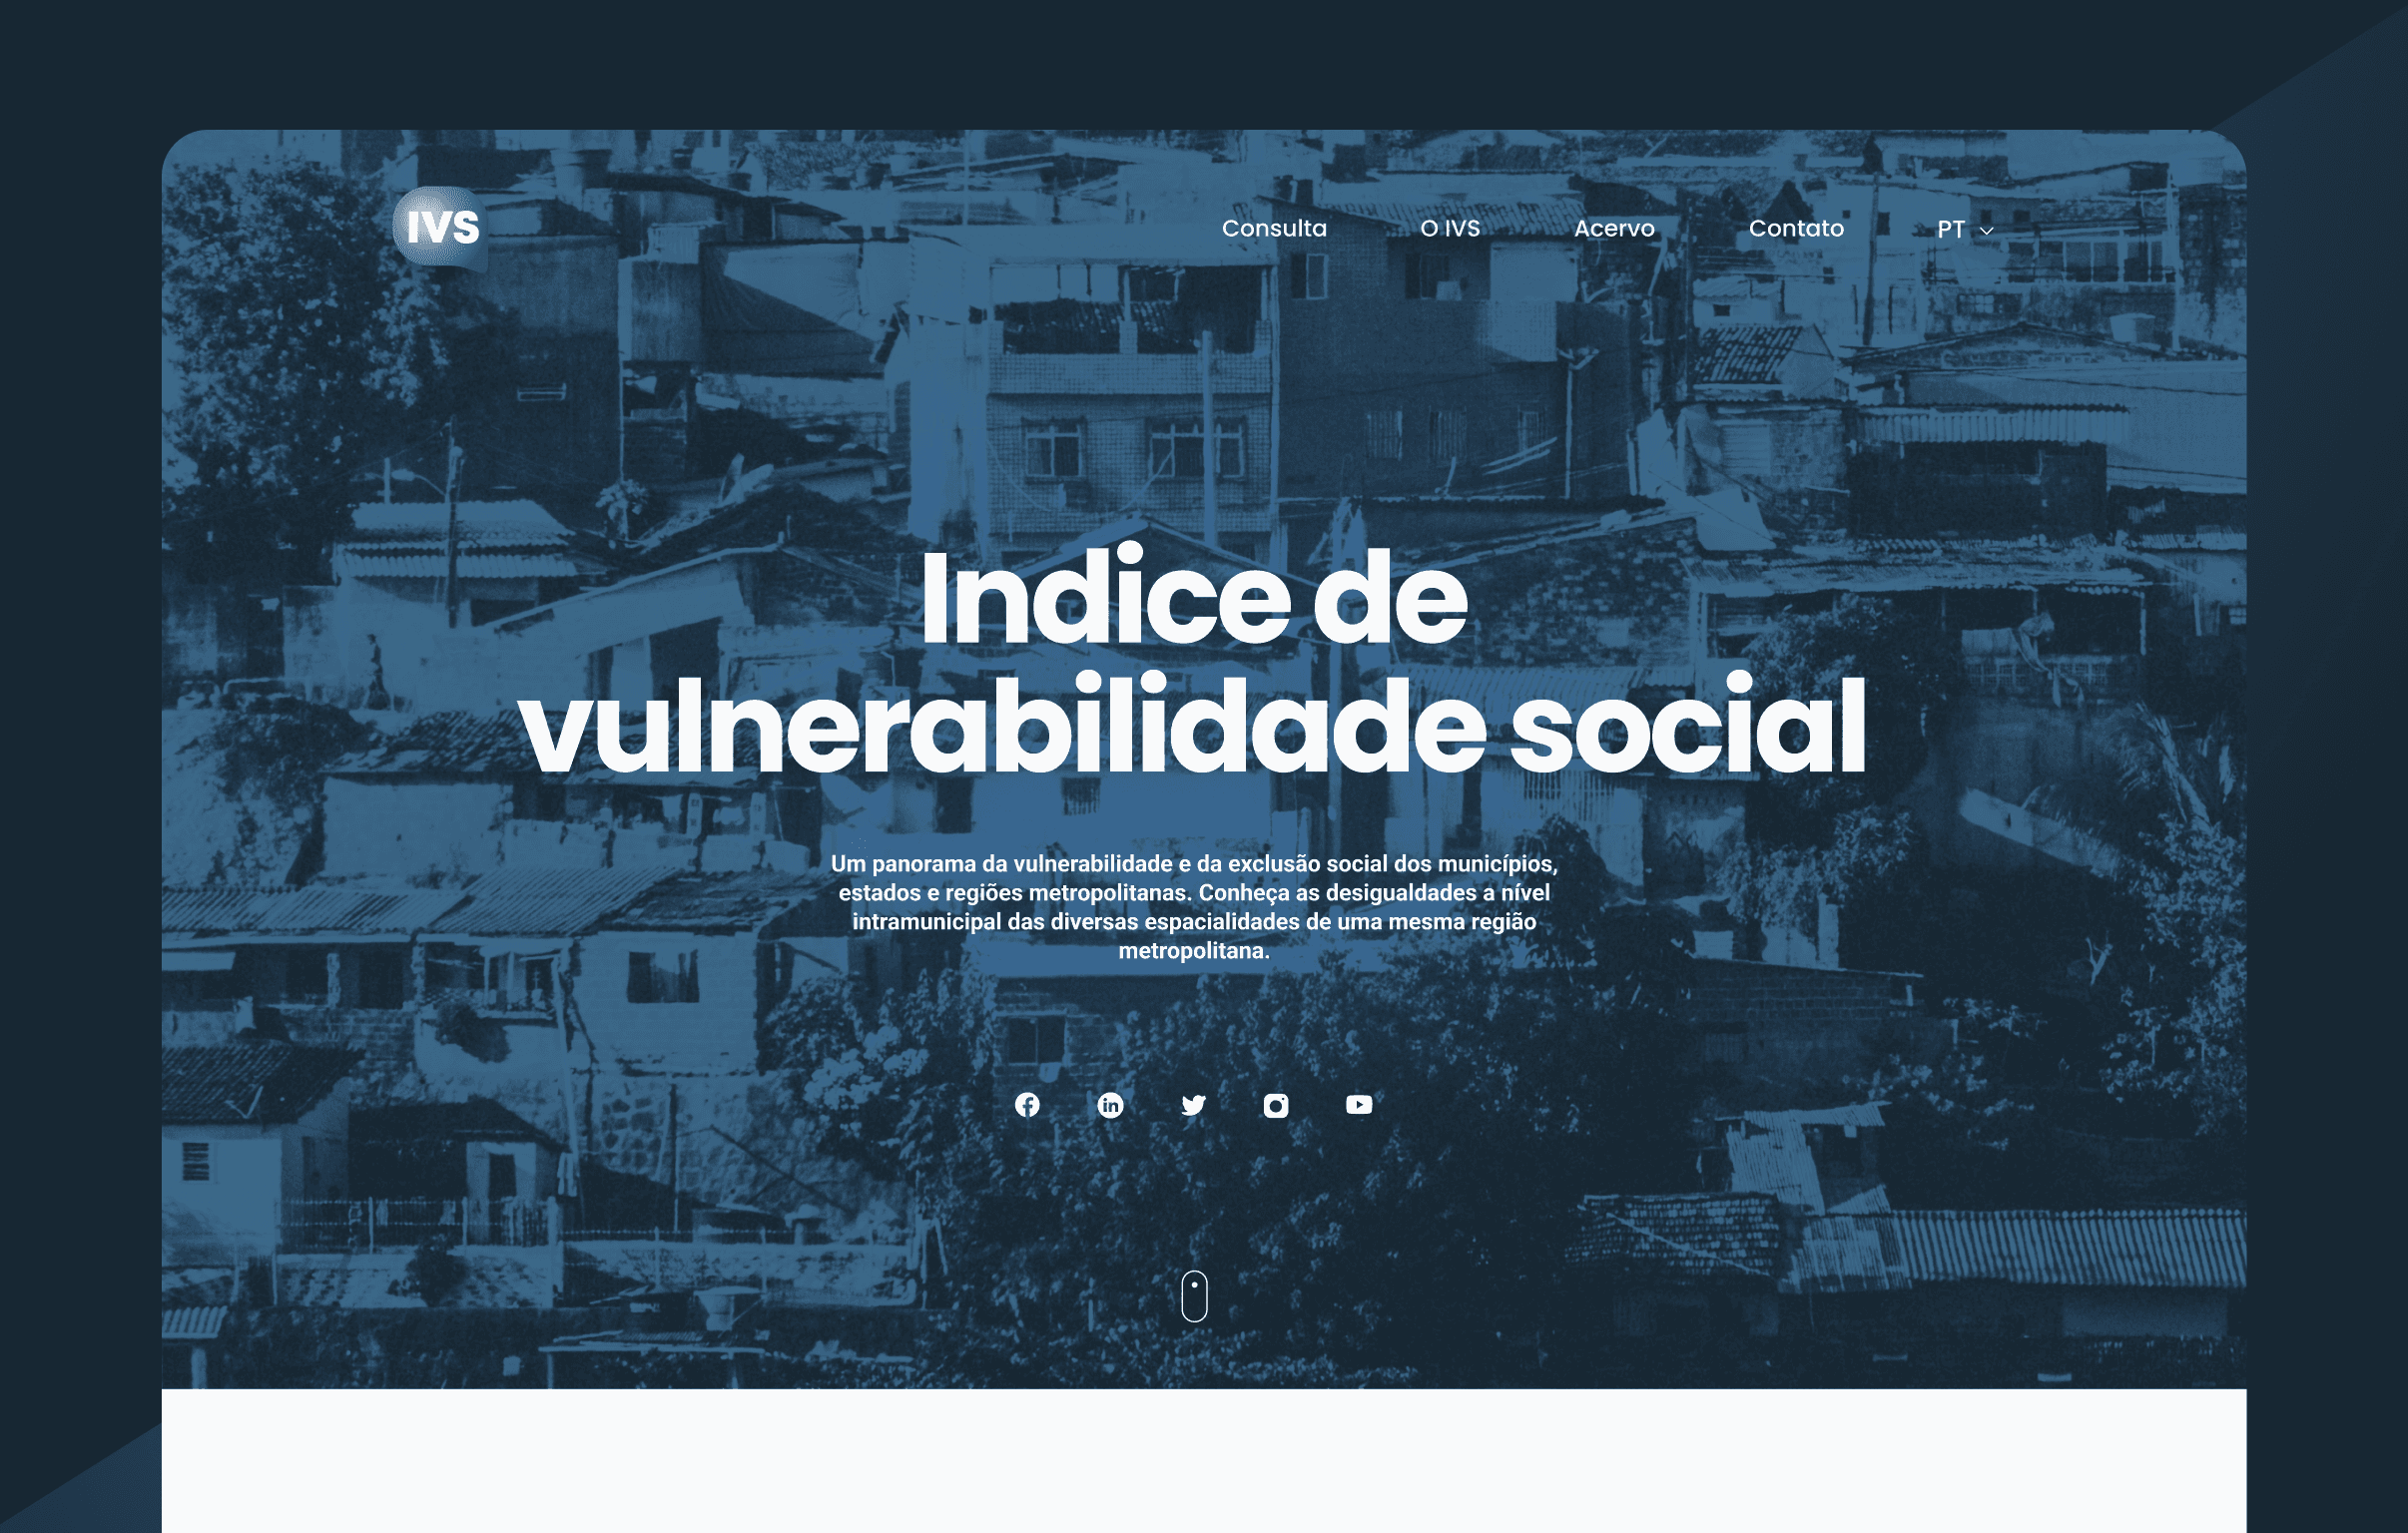
Social Vulnerability Index (IVS)
Research
Information Architecture
Prototyping
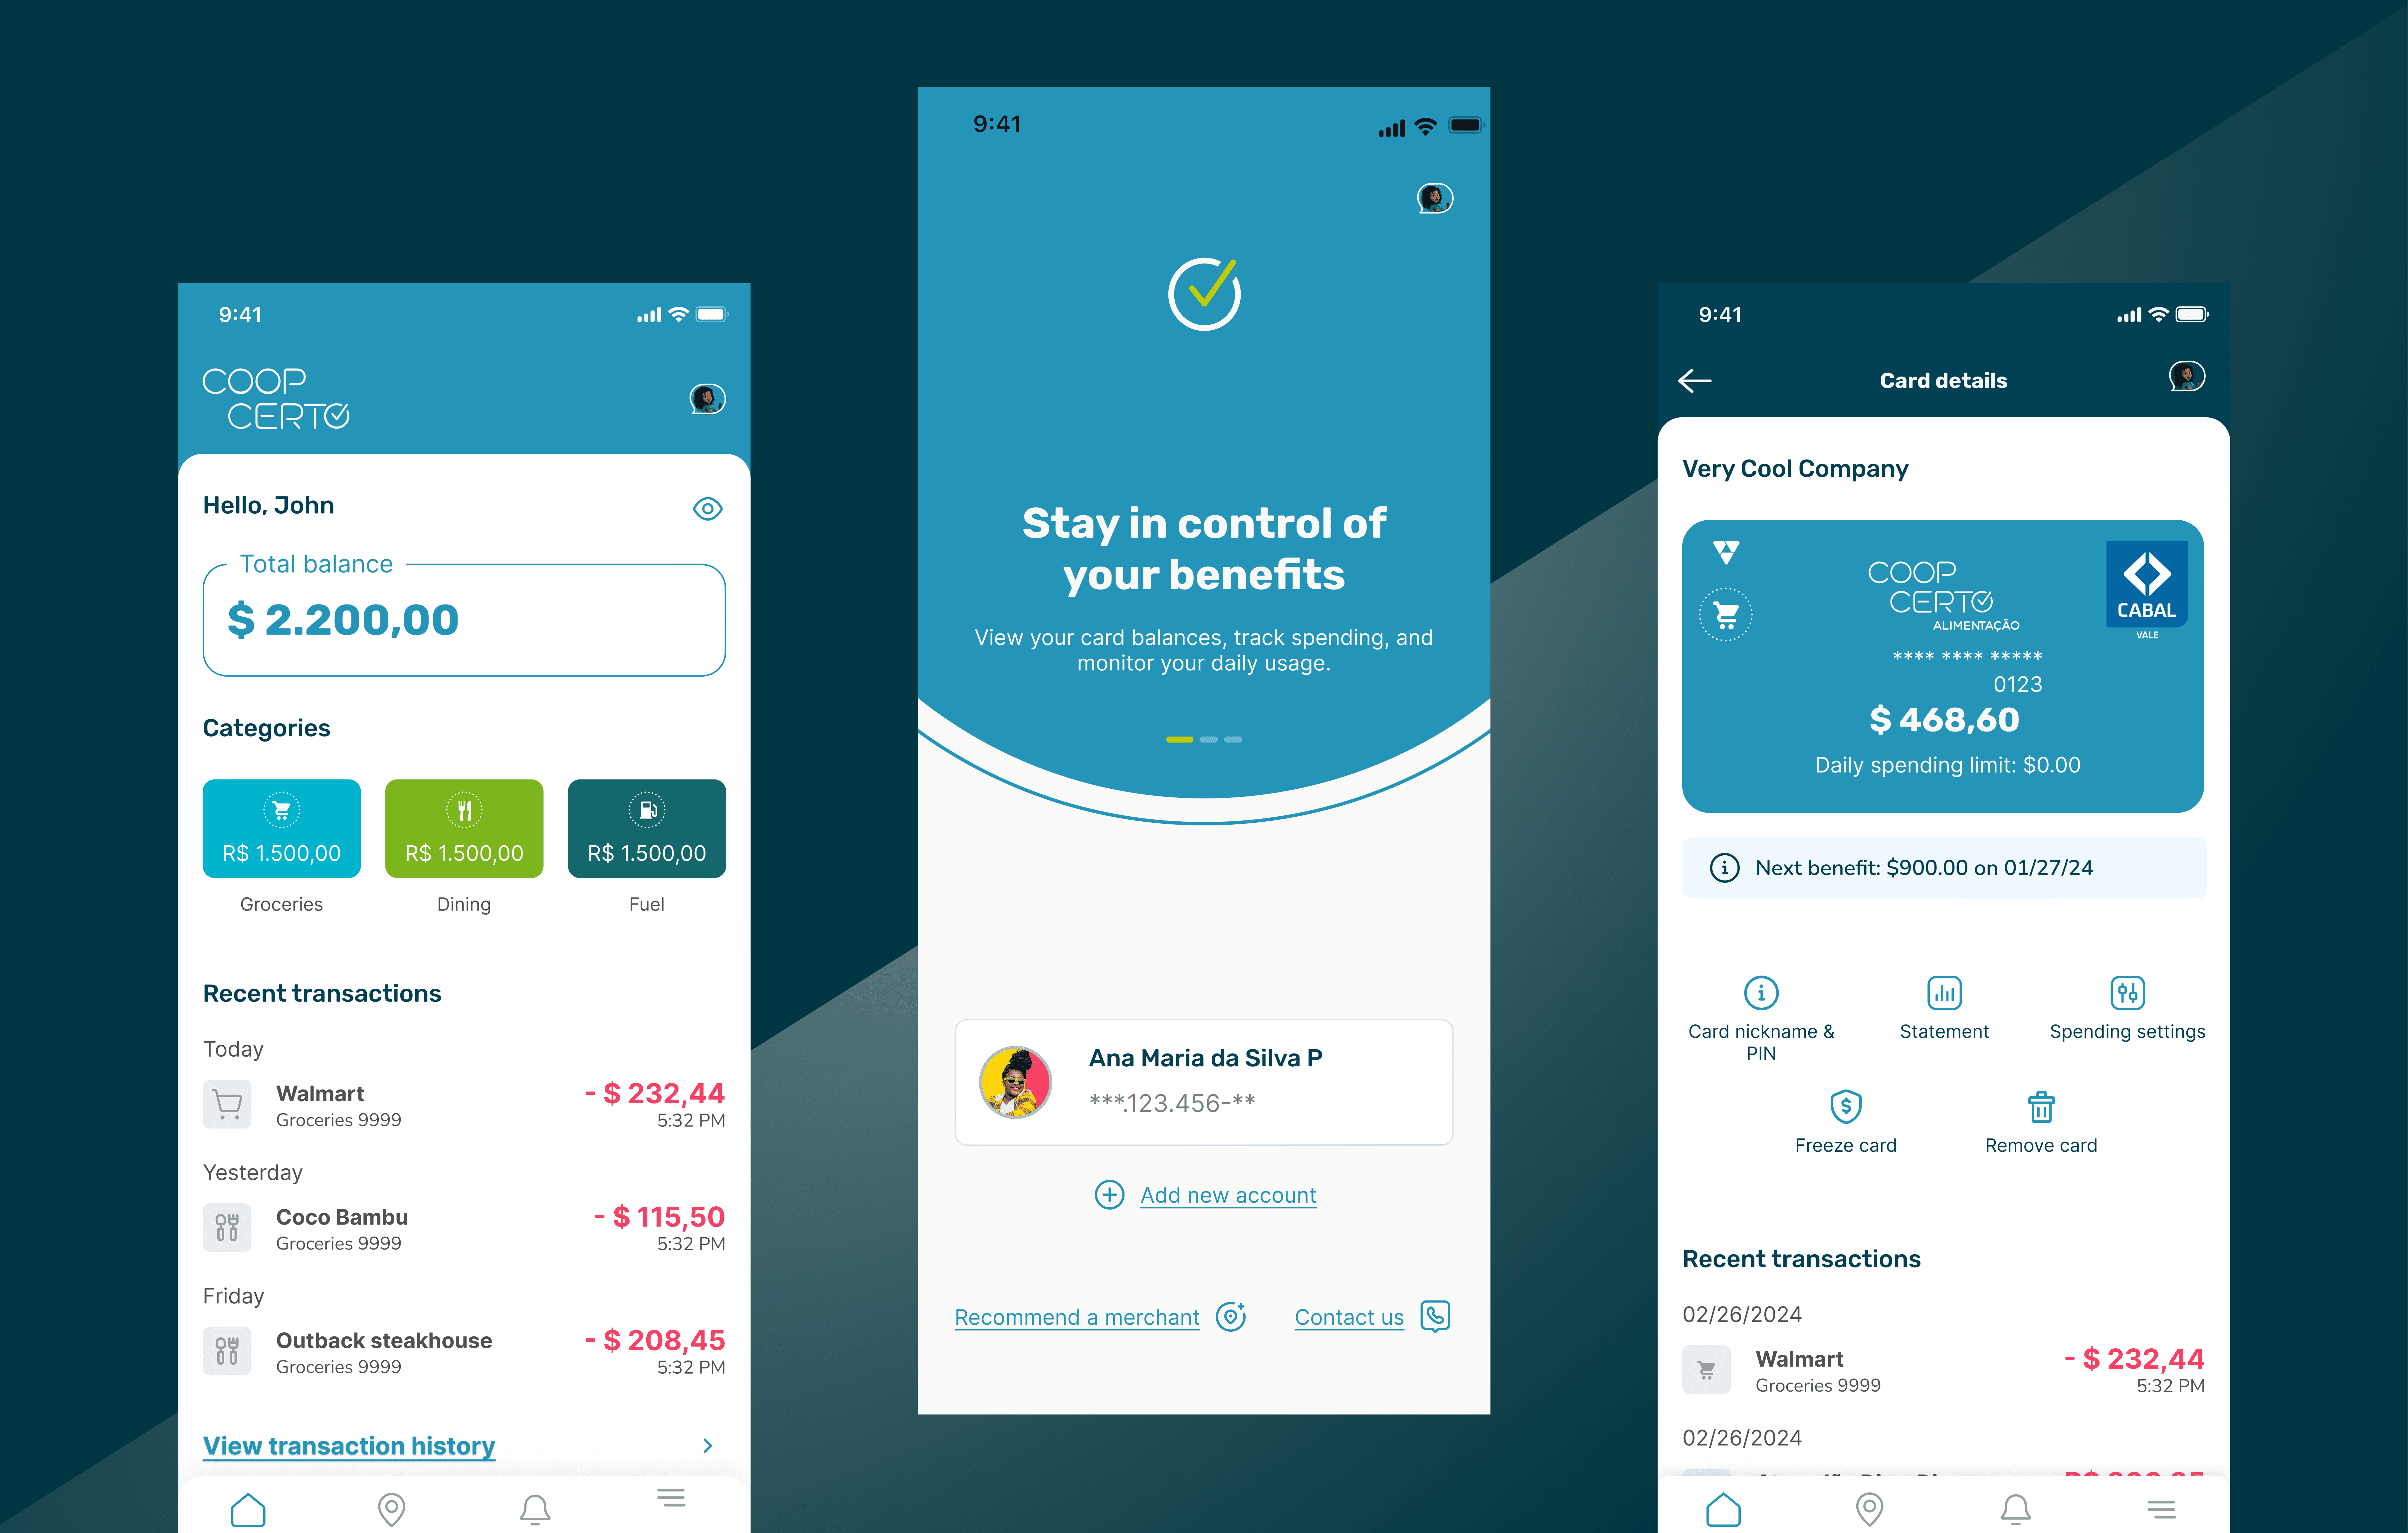
Revamping the Social Vulnerability Index platform by the Institute of Applied Economic Research (IPEA). The platform aims to provide straightforward access to information about individuals living in social vulnerability across Brazil.
2021
Year
1 year
Duration
Think Tank
Field
Figma
Tools
Project Details
Main Goal
The project's objective was to overhaul and modernize the entire IVS platform. The previous website was outdated and lacked organization, with a dense and cluttered search functionality.
Challenges
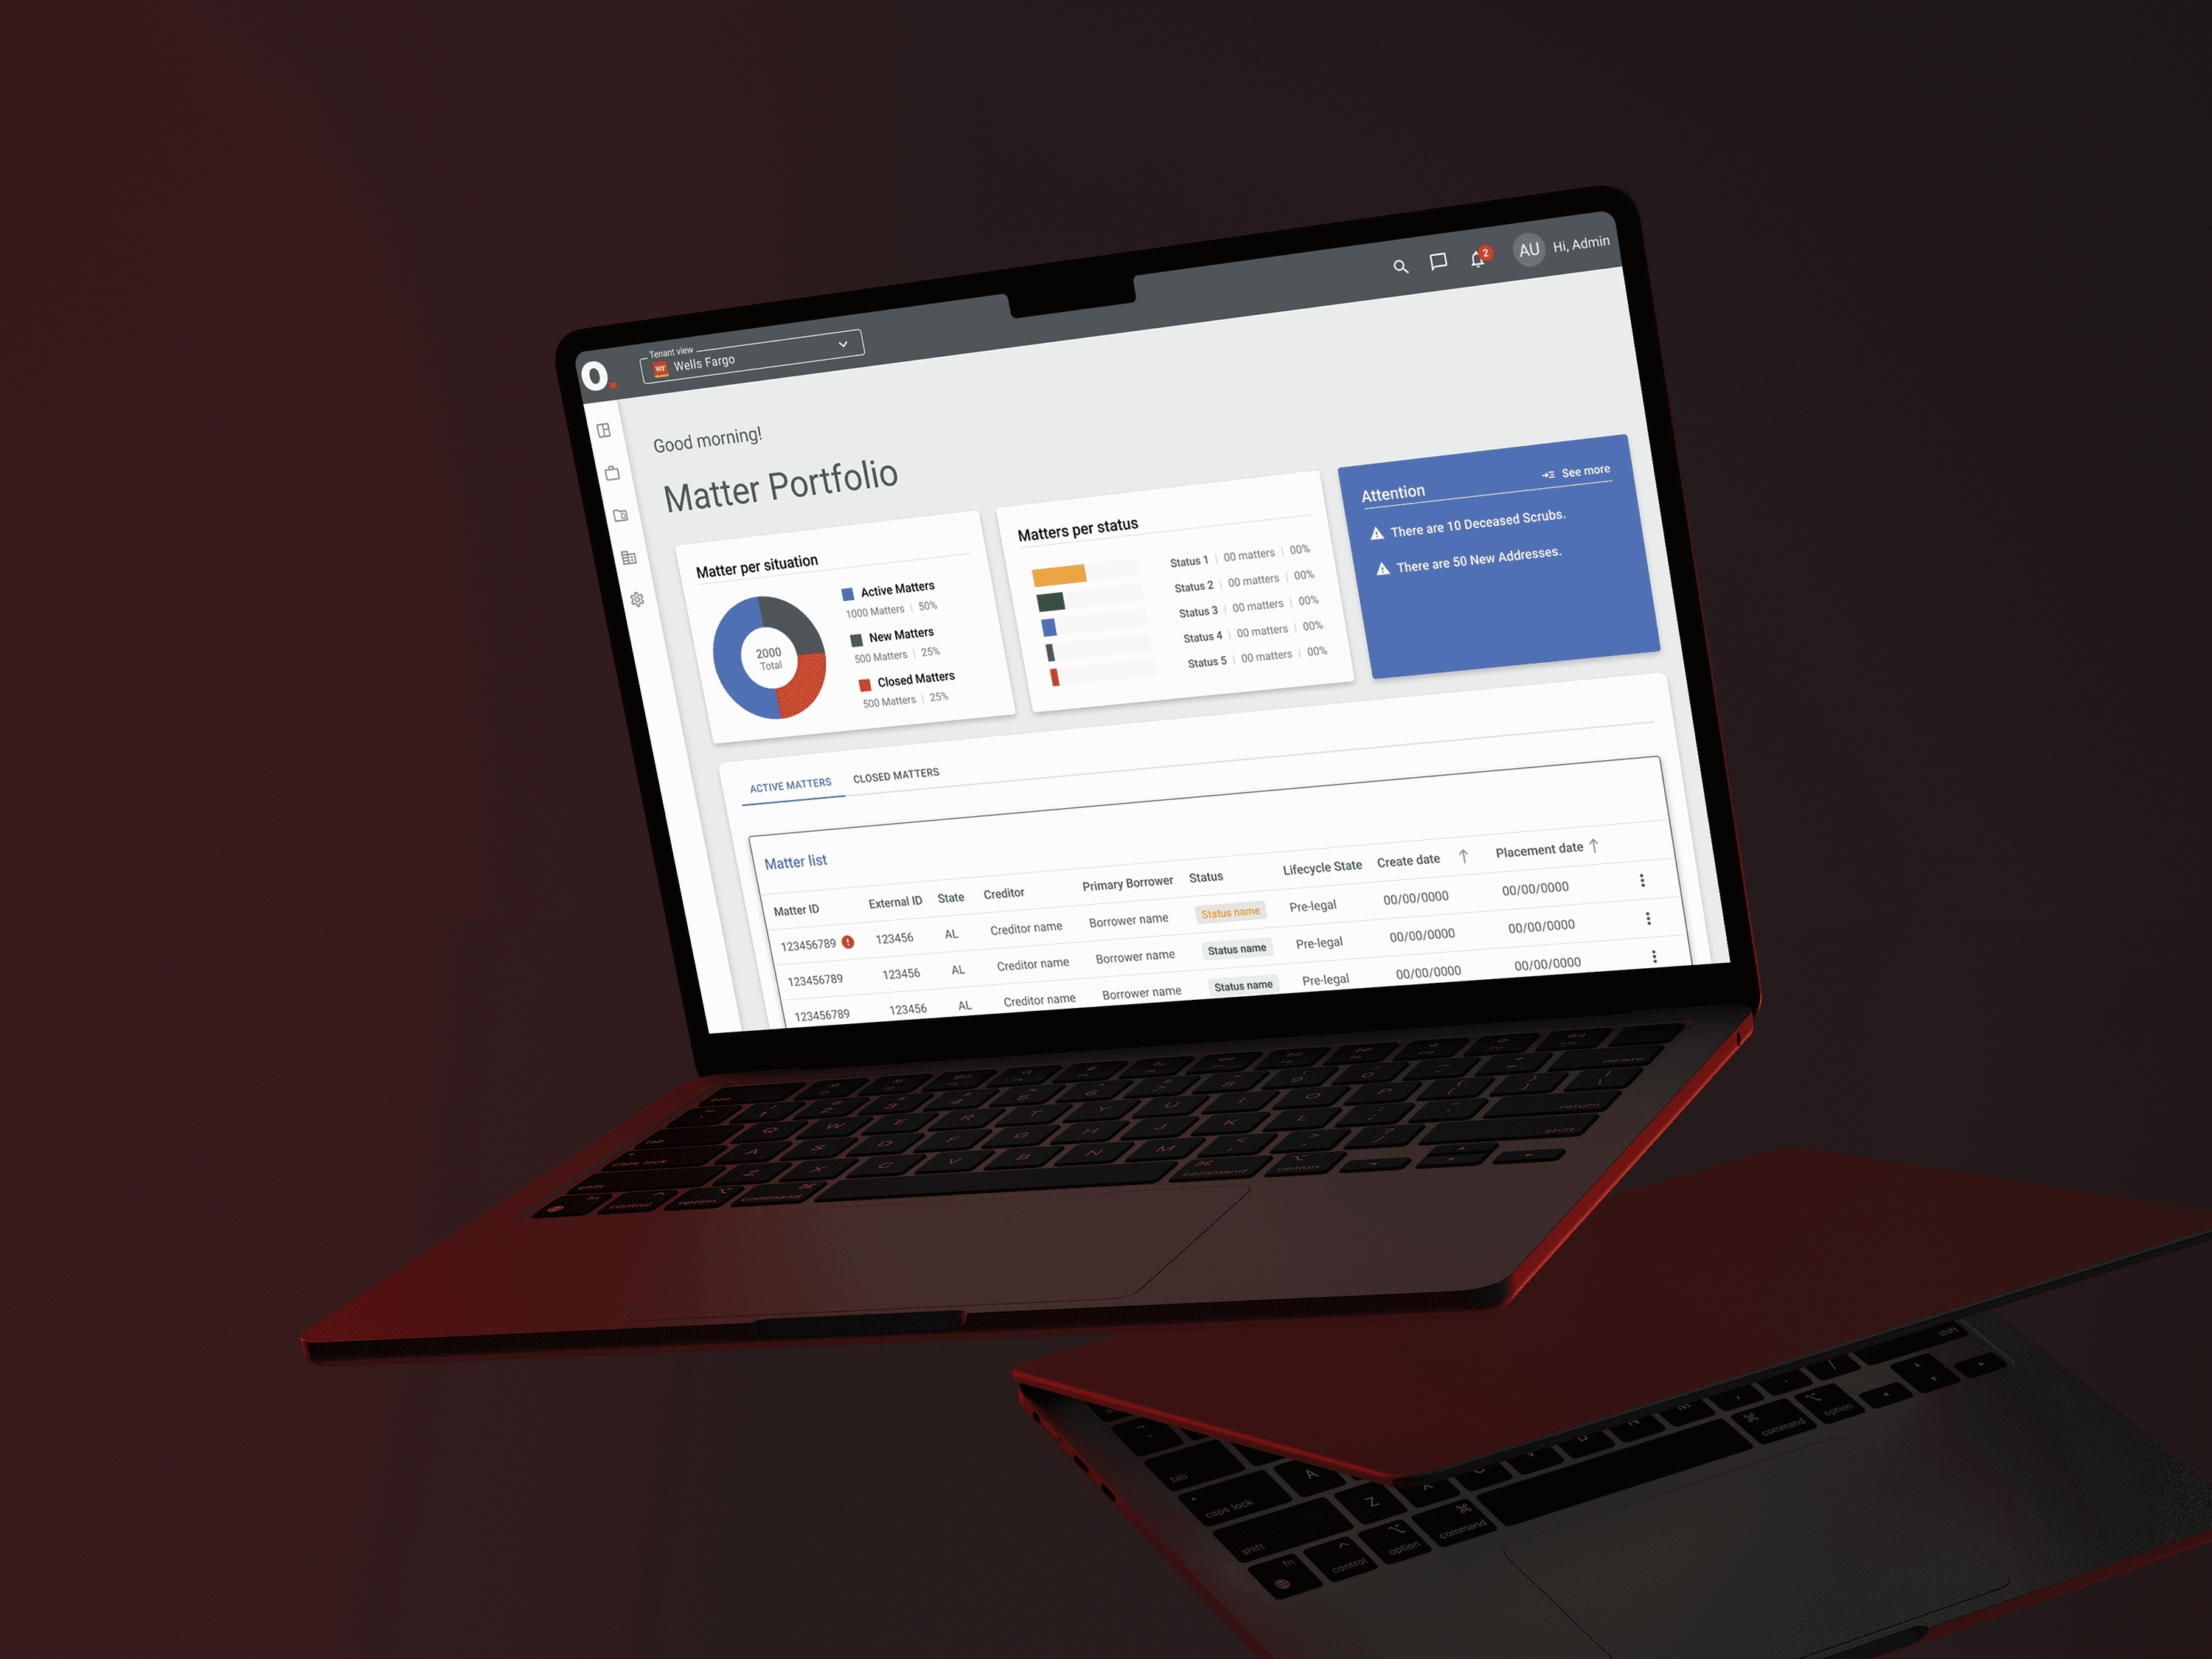
The IVS platform involves a vast ETL process, managing numerous databases covering the entire national territory. Creating a well-structured survey to accommodate all this data was undoubtedly the most significant challenge we faced!
Deliverables
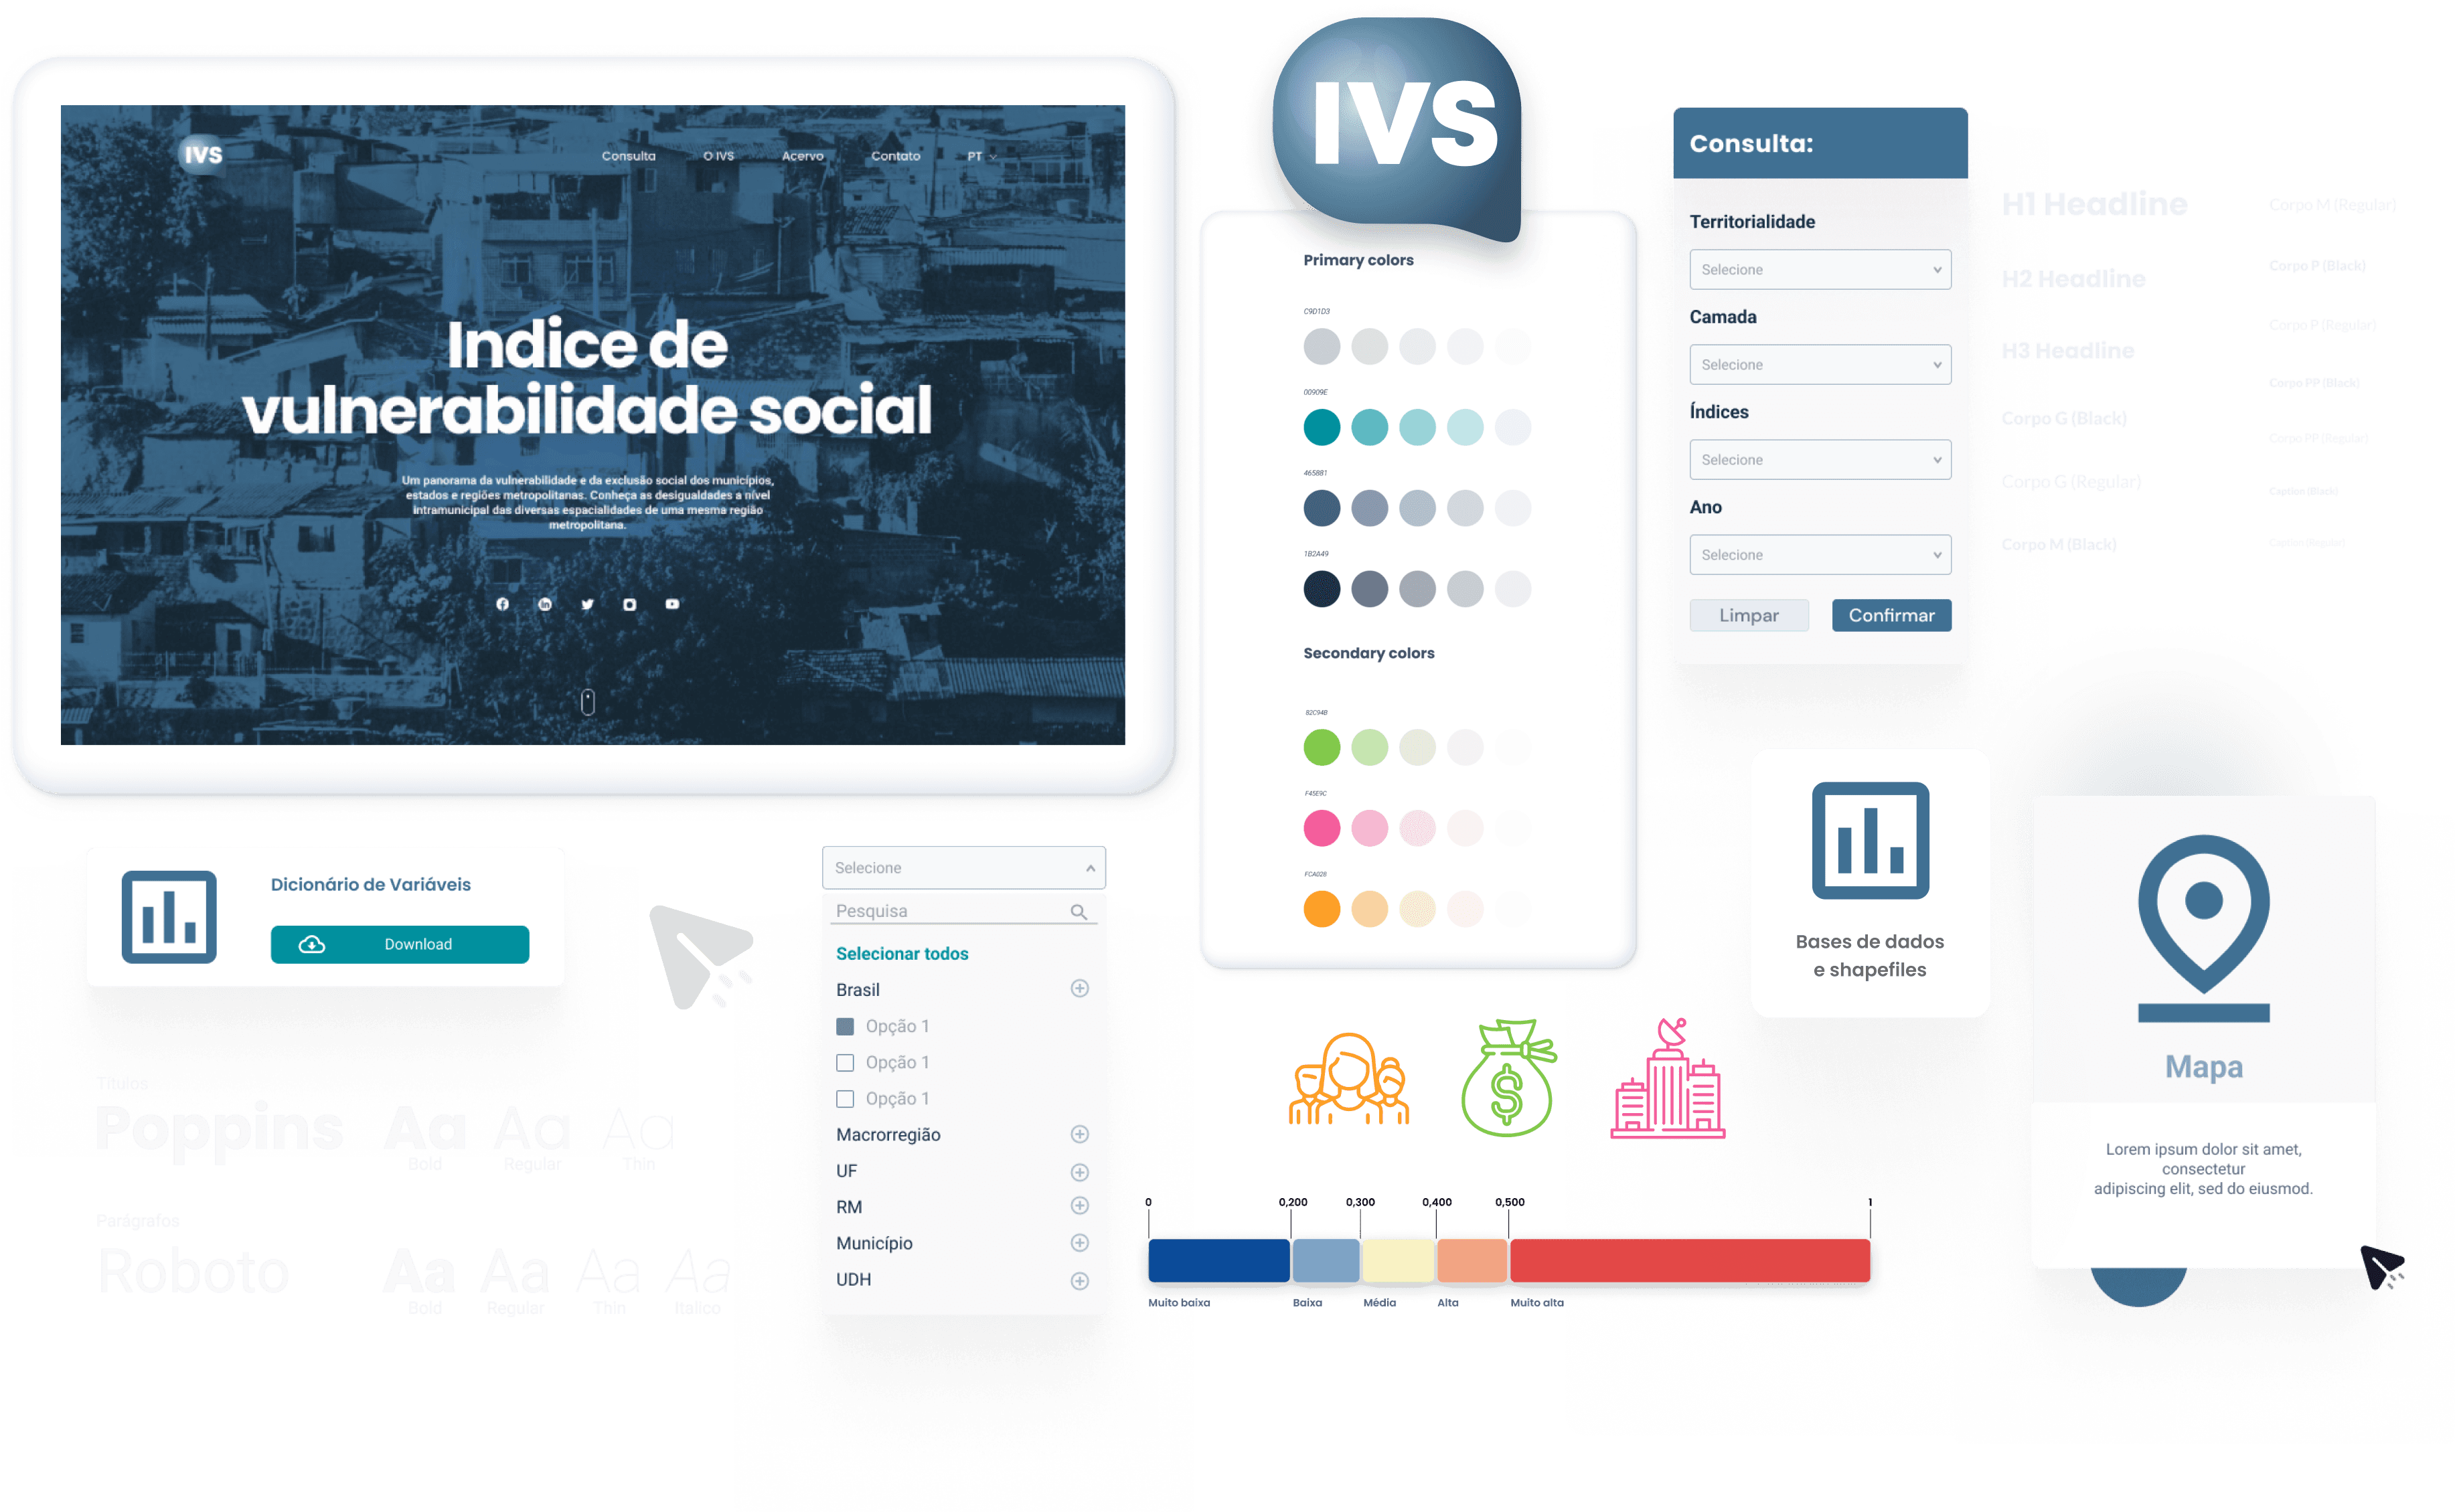
The deliverables were centered around providing the complete revamped platform, a style guide, and a site map.
Methodology
Process
The project followed a streamlined and rapid approach due to the limited timeframe for implementation.
I initiated the process by conducting a series of intensive interviews with IPEA researchers who were frequent users of the platform, as well as researchers from partner institutions. Following this, I developed the site map and utilized data clustering techniques to organize the collected information. Subsequently, I began creating screens for user testing and A/B testing based on these insights.
Site Map

Style Guide
Results
Learnings
The IVS encompasses a vast amount of data, making it a substantial undertaking to organize and address the research challenges. This extensive effort greatly contributed to enhancing my skills in information architecture.
Cool Data
Highlight in numbers:
🤘🏻 squad of 3 (me and 2 devs)
⏳ 6 months
🛠️ 5 funcionallities
💻 8 screens